Plotting signals and task results
Low level function to produce charts and interactively browse signals and annotations produced by other ECGtasks
Some of the relevant features:
- User can interact using mouse shortcuts with several aspects of the visualization, such as zoom, pan and measurements.
- Information of the multilead wave boundaries can be added to the ECG, for example the delineation obtained with wavedet.
- It can “pretty” present the ECG charts for printing to pdf documents
- It can be easily added to your project for debug or result presentation through its versatile interface.
The mouse interaction was adapted from the Dragzoom function, by Evgeny Pr.
Prototype
The function prototype is the following.
function ECG_hdl = plot_ecg_strip( ECG, varargin )
This function accepts as arguments the arg_name/arg_val method described below.
Arguments
ECG: [numeric | char | ECGwrapper] REQUIRED. Signal matrix of dimension
[nsamp nsig]where:- nsamp: time length in samples
- nsig: number of ECG leads or number of signals.
A recording full-path filename or an ECGwrapper object are also accepted.
ECG_header: [struct] OPTIONAL. Description of the ECG typically available in the header. See ECG header description.
Start_time: [numeric] OPTIONAL. Start time in seconds.
0 (default)End_time: [numeric] OPTIONAL. Start time in seconds.
end (default)QRS_locations: [numeric] OPTIONAL. QRS complex detection samples.
[] (default)QRS_start_index: [numeric] OPTIONAL. Start at the i-th QRS_start_index heartbeat in QRS_locations, or
QRS_locations(QRS_start_index).1 (default)QRS_complexes: [numeric] OPTIONAL. Display the amount of QRS_start_complexes heartbeats from the QRS_start_index.
QRS_start_index + 10 (default)Lead_offset: [numeric] OPTIONAL. A DC value
[nsig 1]to be added to each lead.zeros(nsig,1) (default)Lead_gain: [numeric] OPTIONAL. A value
[nsig 1]to be multiplied by each lead.ones(nsig,1) (default)ECG_delineation_single_lead: [struct/ECGwrapper] OPTIONAL. Annotation struct of size
[nsig 1]described here. Each field of size[1 nhb], beingnhbthe amount of heartbeats. If an ECGwrapper was provided, it tries to get results from anECG_delineationtask.[] (default)ECG_delineation_multilead: [struct/ECGwrapper] OPTIONAL. Annotation struct with the same fields of and characteristics of
ECG_delineation_single_lead. If an ECGwrapper was provided, it tries to get results from anECG_delineationtask.[] (default)Heartbeat_classification: [struct/ECGwrapper] OPTIONAL. Heartbeat labels provided as a struct with the following fields
- time, an array of
[nhb 1]with the sample locations of each heartbeat. - anntyp, a char array of
[nhb 1]with the label of each heartbeat, according to Physionet or the EC-57 AAMI recommendation. Commonly N, S, V, F, Q.
If an ECGwrapper was provided, it tries to get results from an
ECG_heartbeat_classifiertask.[] (default)- time, an array of
Title: [string] OPTIONAL. Description title.
[recname - time interval] (default)DetailLevel: [string] OPTIONAL. The details included in the ECG plot depends on the zoom level and the data provided. Possible values:
- ‘all’, overprint all info available.
- ‘single-lead’, overprint ECG delineation results.
- ‘multilead’, overprint ECG multilead delineation results.
'none' (default), display only signals.
OnlyECG: Display only ECG signals. Filter non-ECG signals based on their descriptions in
ECG_header.descfield.FilterECG: Perform standard noise removal on ECG signals. Low pass @ 35Hz and baseline wander removal by cubic splines or median filtering.
PrettyPrint: [bool] OPTIONAL. Prepare the plot for printing as a PDF.
false (default)ReportFilename: a string with the full filename to export screen captures.
[signal_path\signal_name.pdf] (default)Figure_handle: [axes handle] OPTIONAL. Choose the figure to display the plot.
gca (default)
Mouse interaction
Keyboard hotkeys
h : Show this help
+ : Zoom plus
- : Zoom minus
d : Toggle the detail level of the annotations
a : Toggle the annotations graph mode.
0 : Set default axes (reset to original view)
c : On/Off pointer in crosshair mode
g : If pressed and holding, change lead gain with scroll
o : If pressed and holding, change lead offset with scroll
x : If pressed and holding, zoom and drag works only for X axis
y : If pressed and holding, zoom and drag works only for Y axis
m : If pressed and holding, Magnifier mode on
p : On/Off paper mode
r : Export format (PDF/PNG)
s : Export current view
Normal mode
single-click and holding LB : Activation Drag mode
single-click and holding RB : Activation rubber band for region zooming
single-click MB : Activation measuring rubber band mode
scroll wheel MB : Activation Zoom mode
double-click LB, RB, MB : Reset to Original View
Magnifier mode (m key)
single-click LB : Not Used
single-click RB : Not Used
single-click MB : Reset Magnifier to Original View
scroll MB : Change Magnifier Zoom
double-click LB : Increase Magnifier Size
double-click RB : Decrease Magnifier Size
Examples
The easiest way of invoking this function is via an ECGwrapper object:
>> plot_ecg_strip(ECGw)

#######################
# plot_ecg_strip help #
#######################

Mouse actions:

  Normal mode:
          single-click and holding LB : Activation Drag mode
          single-click and holding RB : Activation Rubber Band for region zooming
          single-click MB             : Activation 'Extend' Zoom mode
          scroll wheel MB             : Activation Zoom mode
          double-click LB, RB, MB     : Reset to Original View
  Magnifier mode:
          single-click LB             : Not Used
          single-click RB             : Not Used
          single-click MB             : Reset Magnifier to Original View
          scroll MB                   : Change Magnifier Zoom
          double-click LB             : Increase Magnifier Size
          double-click RB             : Decrease Magnifier Size

Hotkeys in 2D mode:

          'h'                         : Show help
          '+'                         : Zoom plus
          '-'                         : Zoom minus
          'd'                         : Toggle the detail level of the annotations
          'a'                         : Toggle the annotations graph mode
          '0'                         : Set default axes (reset to original view)
          'c'                         : On/Off pointer in crosshair mode
          'g'                         : Change lead gain with scroll
          'o'                         : Change lead offset with scroll
          'x'                         : Zoom and drag works only for X axis
          'y'                         : Zoom and drag works only for Y axis
          'm'                         : If pressed and holding, Magnifier mode on
          'p'                         : On/Off paper mode
          'r'                         : Format of the exported file (PDF/PNG)
          's'                         : Export current view
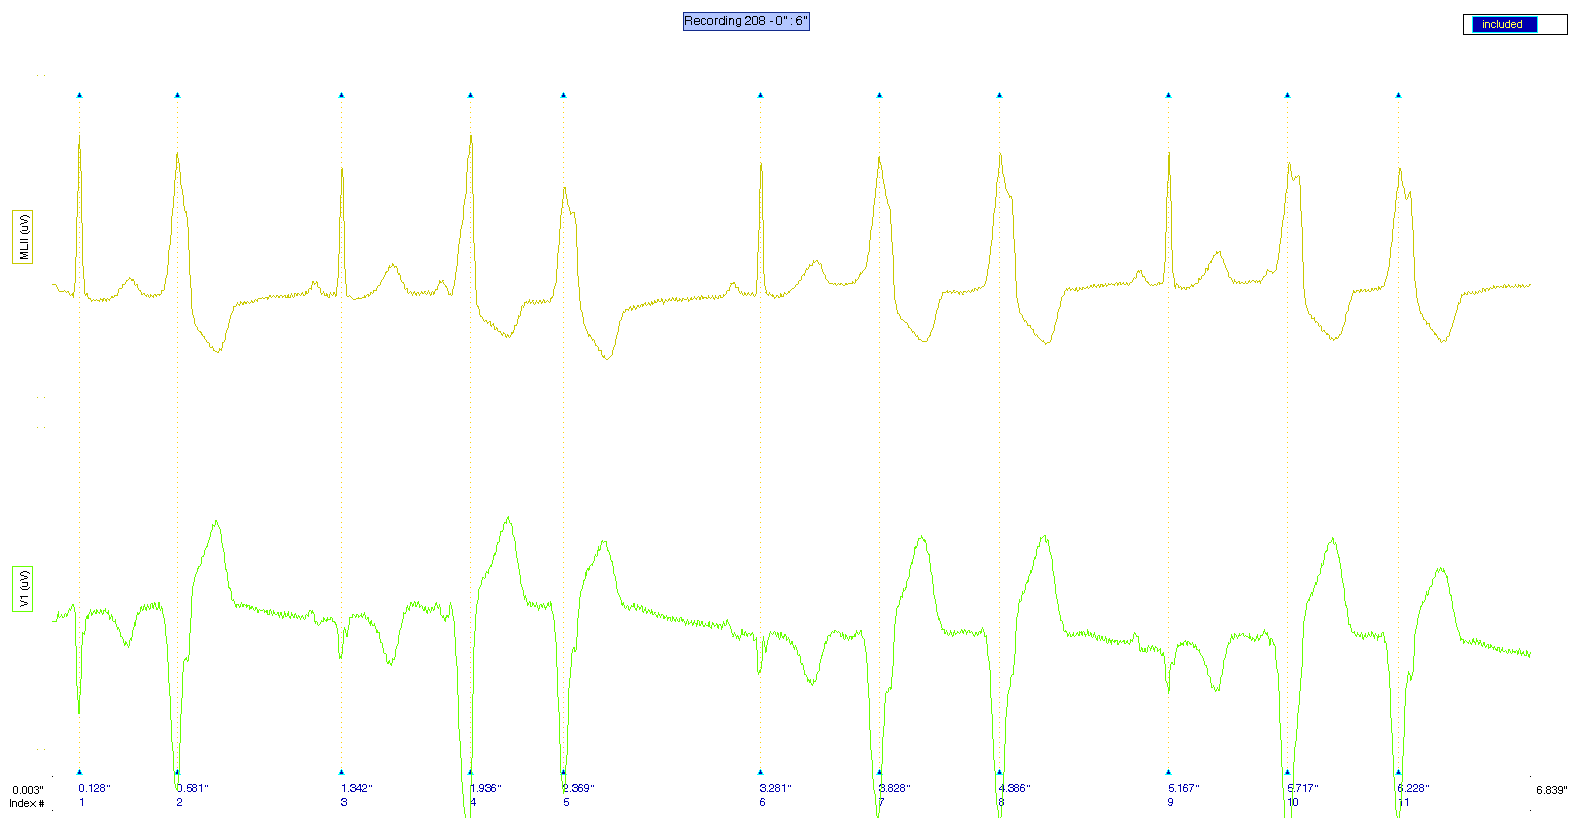
As you can see, the basic help is displayed, and this figure is shown as a result: